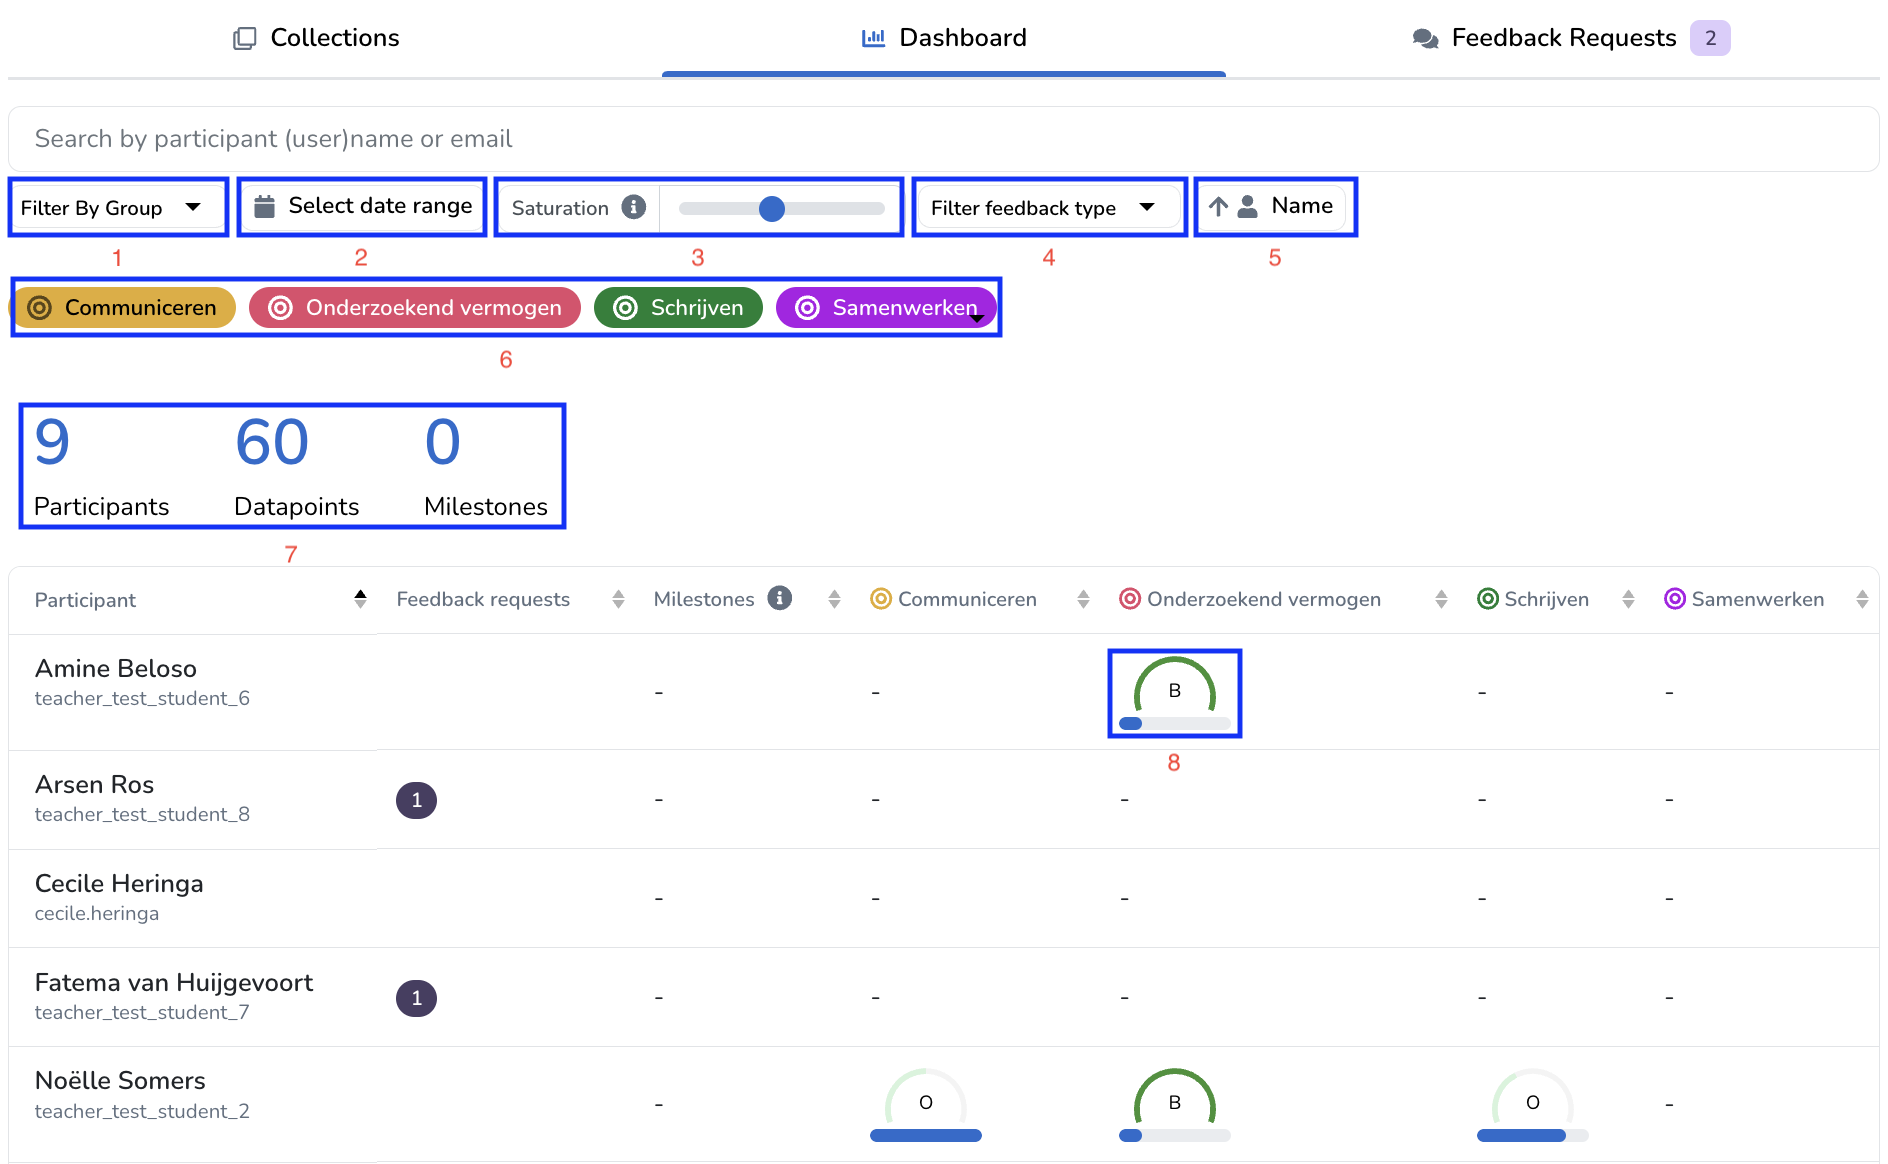
The course and programme dashboard is designed for educators and administrators, this dashboard provides a concise summary of multiple students' progress within a specific course or programme. It's an effective tool for obtaining a macro-level perspective on student performance, helping educators make informed decisions to enhance educational outcomes.
¶ How to access the course / programme dashboard
You can access the course/programme dashboard by navigating to the respective course/programme and clicking on the 'Dashboard' tab at the top of your screen.

¶ Overview

¶ Scope
The dashboard presents you with an overview of all students your are supervising for the respective course/programme. The feedback is aggregated over all the work of students you are supervising. So if this is a programme dashboard this will include all feedback from the nested courses and collections where you are also supervising these students.
¶ Filters
At the top you have a menu that can be used to evaluate specific categories (6), date ranges (1) (for example only last study year), groups (2), and feedback types (4). The filters affect the displayed participants as well as the overall statistics (7) above the table.
The sort button (5) determines how the table is sorted. Setting this to ' score' sorts all category feedback according to their average quantitative feedback. This is indicated by the radial gauge (8) for each category. Setting this to 'count' sorts all category feedback according to the amount of recieved feedback. This is indicated by the bar beneath the radial gauge (8), and is best suited to workflows that focus on narrative feedback.
Each of the results in the dashboard is clickable, allowing you to zoom in on the exact data underneath, and even jump to the evidence itself similar to the detailed category insights of the user dashboard.
¶ Columns
- Participant: displays the profile picture, name and username of the participant. When you order on this column, it orders by the full name.
- Feedback requests: displays the amount of pending feedback requests the student has made to you in any of the assignments related to the scope.
- Milestones: displays the amount of completed and incompleted milestones. This column is not available if no student has a milestone within the scope.
- Category columns: This is indicated by the bar beneath the radial gauge and a written evaluation in the center. The bar indicates the amount of feedback compared to the saturation slider (3). The radial gauge indicates and the evalutation in the center display the average evaluation at the highest category level the student received feedback. For narrative feedback workflows, only the bar is shown.