The user dashboard is dedicated to tracking the progress of an individual student and provides insights into their overall academic journey.
¶ How to access the user dashboard
You can access the user dashboard via two routes:
- Navigate to your 'Home' page, and select 'Dashboard', or use the main menu at the top right of the page and select 'Dashboard' directly. This will show your own dashboard by default, but you can search a specific user at the top.
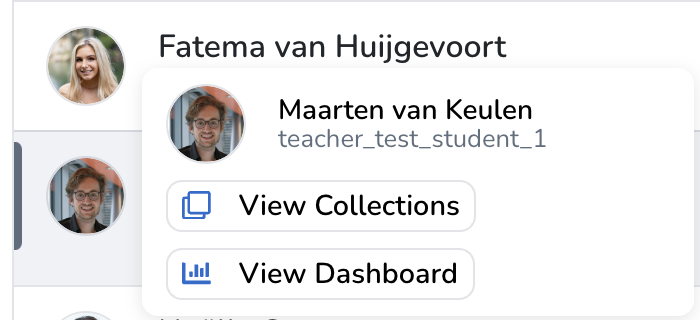
- Teachers can hover over the name or avatar of any student they supervise and select 'View Dashboard' in the menu that appears.
¶ What data is accessible in the user dashboard
Multiple users can visit a user's dashboard. However, the views of each user might differ. This is because the dashboard is automatically populated based on what parts of a user's portfolio you can view. If you can view a collection with sufficient supervision rights, that data will automatically be visible in the user dashboard. Currently, access granted via share requests does not add data to the dashboard.
¶ Viewing a specific date range
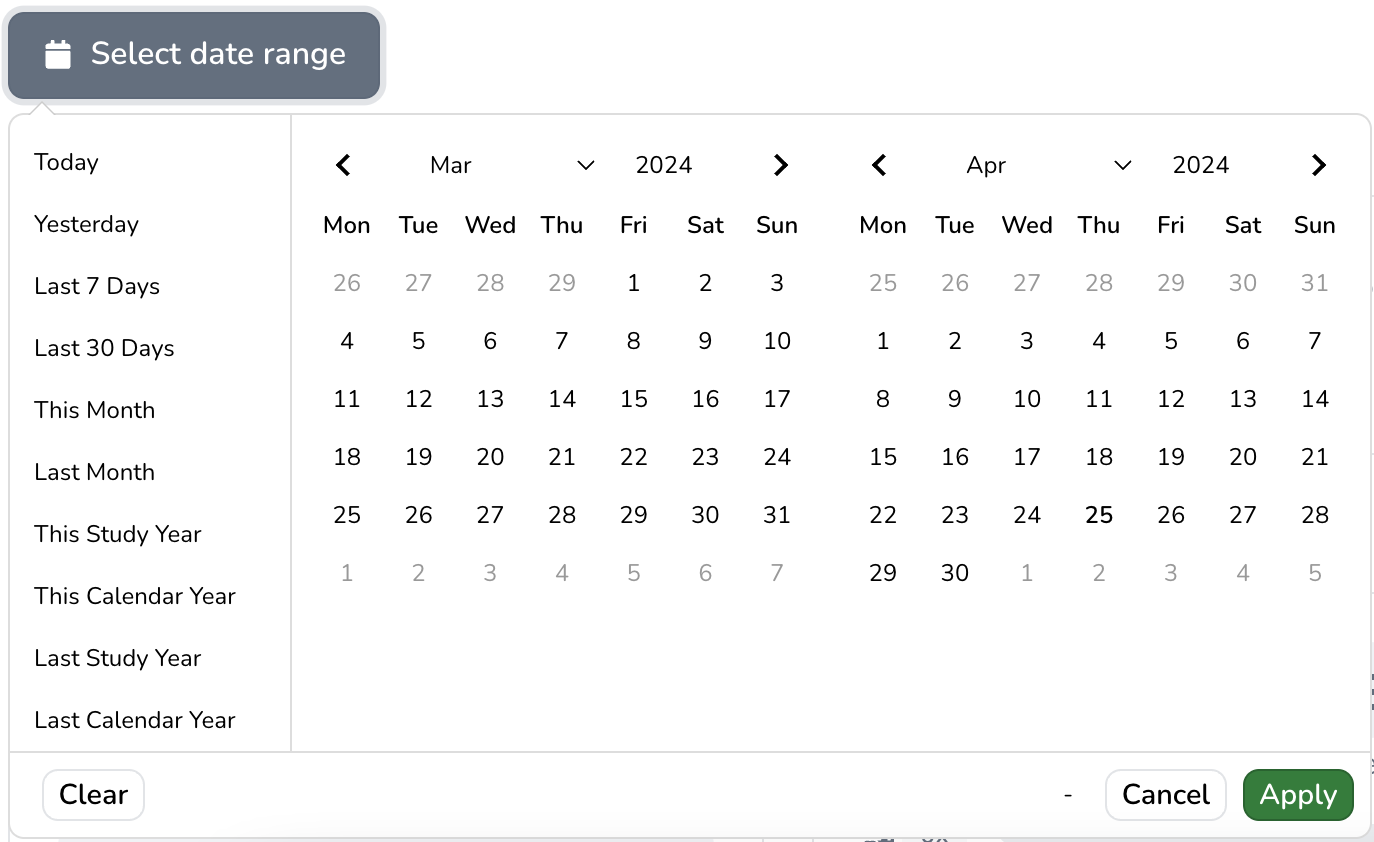
You can filter the user dashboard data to a specific time range; for example, you might only be interested in results achieved this study year. You can achieve this via the 'Select Date Range' filter at the top of the page.
¶ Switching between the dashboard of different users
Sometimes you might want to look up the dashboard of a specific user, or switch between the view of different users. You can achieve this via the 'Dashboard' button at the top of the page.

Just search for the user you are looking for and hit enter.
¶ User dashboard content
The content of the user dashboard can be broken up into four topics:
- Category-focused insights
- An overview of all received feedback
- An overview of all requested feedback
- An overview of all milestones
We go over each of these topics in their dedicated section.
¶ Category-focused insights
The user dashboard will start by showing an overview of each of the categories a user has received feedback on and you are involved with.
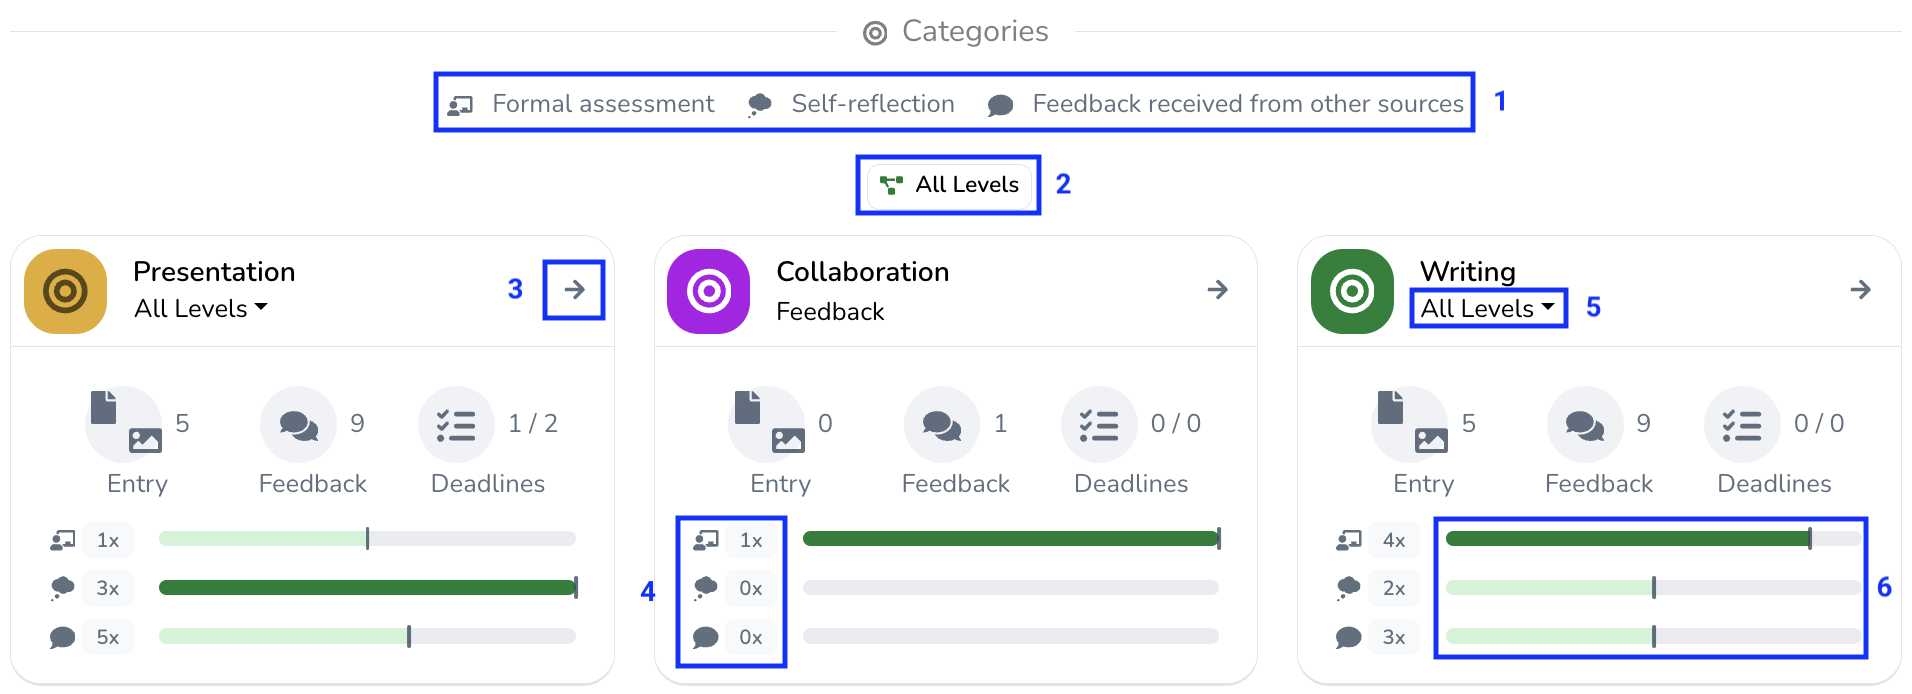
- By default, received feedback is grouped into three groups: formal assessments, self-reflections, and feedback received from other sources.
- Each category will show an overview for all of its feedback levels for a specific level. At the top, there is a toggle that will switch between showing all levels or the highest achieved level for all of the category cards.
- Each category presents an overview of the student's development. You can open the card for more detailed insights.
- Each category presents a counter representing how much feedback was received from each respective group (1). These counters include both narrative and quantitative feedback, whilst (5) only shows results of quantitative feedback.
- For each feedback group, an average of the quantitative evaluations is shown (6). Note that these only address holistic quantitative evaluations, that is evaluations addressed at the category level itself, and not at a specific subcategory. To access subcategory specific insights, you should inspect the card as outlined in step three.
¶ Detailed category insights
You can inspect any category to get more detailed insights. This will present you with three tabs:
- 'Description', shows the outline of the category as defined by the education or student.
- 'Feedback', shows a list view of all received category feedback.
- 'Analytics', shows a detailed visualization of the development of the student over time.
¶ Filtering the category feedback
Both the 'Feedback' and 'Analytics' tab can be filtered further to present more specific information. You will find the filters 'Filter by category level' and 'Filter by subcategory' just below the tab headers themselves:

By default, data is shown for all category levels, and only feedback addressed at the category itself is shown (holistic feedback towards the category). If desired, you can use the filters to only look at specific levels and/or one or more specific subcategories.
¶ Inspecting a feedback activity
Each feedback activity displayed under both the 'Feedback' and 'Analytics' tab can be inspected for more details.
- Under the 'Feedback' tab, it is as simple as clicking on any feedback activity in the list of activities.
- Under the 'Analytics' tab, you can click on any data point in any of the graphs to inspect the details of the feedback activity itself.
Doing so will open a form showing all of the given feedback part of that feedback activity as well as the full author information.
¶ Inspecting the context of the feedback activity
When you inspect a feedback activity, you have the ability to open the full context of that activity (for example, by viewing the exact feedback mode that yielded that result) via the 'View Context' button at the bottom of the form. This will open a new browser tab, so make use of this to quickly return to the dashboard of the user you were evaluating.
¶ List of all category feedback
When inspecting a category for more detailed insights, one of the options is to view a list of all received category feedback. This is shown under the 'Feedback' tab.
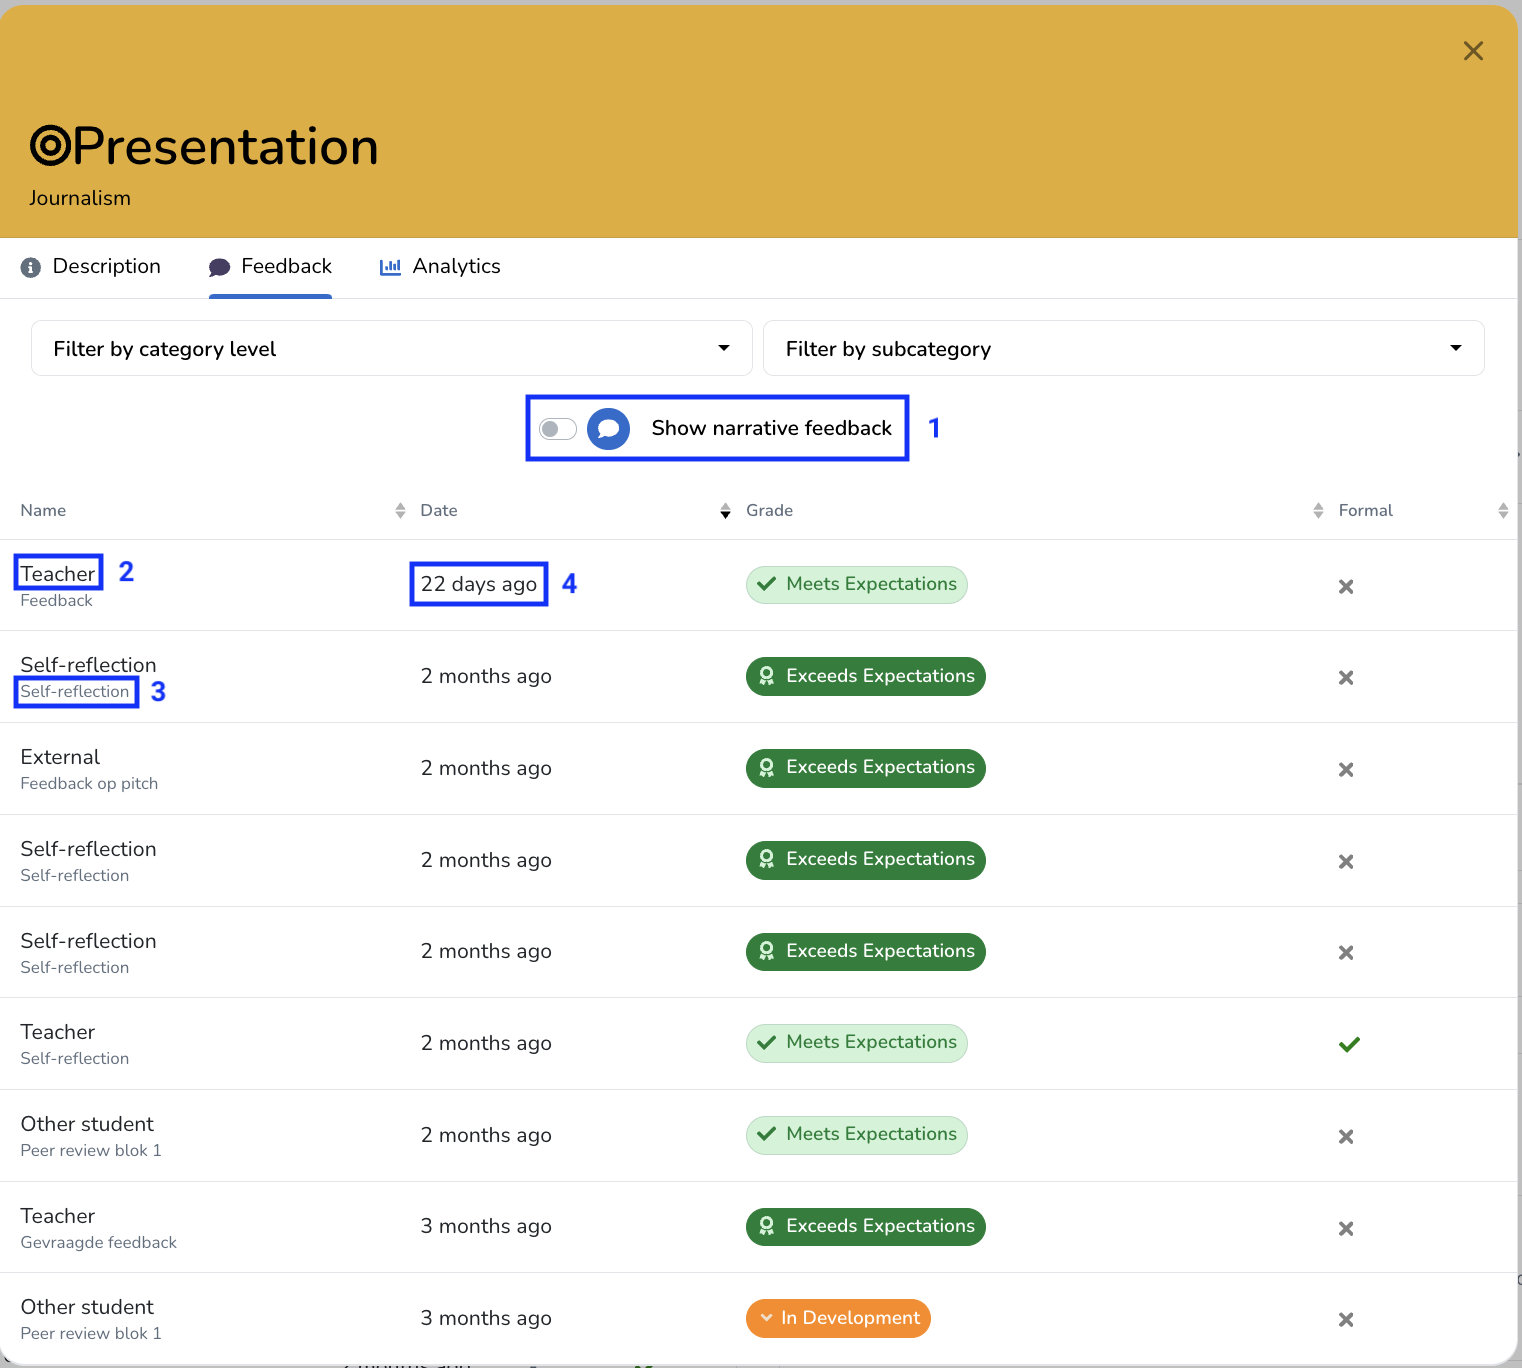
Here you will find a list of each feedback activity related to the category.
- It is possible to 'Show narrative feedback' directly in the list by using the toggle at the top.
- For each feedback activity, the feedback group/role of the author is displayed.
- For each feedback activity, the name of the activity itself is displayed. In some cases, the name of the evidence that received feedback is displayed instead.
- Each feedback activity also displays the date of the feedback activity. In some cases, the date of the evidence that received feedback is displayed instead.
¶ Showing narrative feedback
By using the toggle outlined above in step 1, you can directly display the received narrative feedback in the list of feedback activities:

This is especially powerful in combination with the ability to filter for one or more specific subcategories, as this will then also display the narrative feedback for those subcategories.
¶ Visual analytics of the development of a student
When inspecting a category for more detailed insights, one of the options is to view a visual analysis of the development of a student. This is shown under the 'Analytics' tab.
¶ (Sub)category development over time
The analytics tab starts with a visualization of the development of the student for the selected (sub)category.
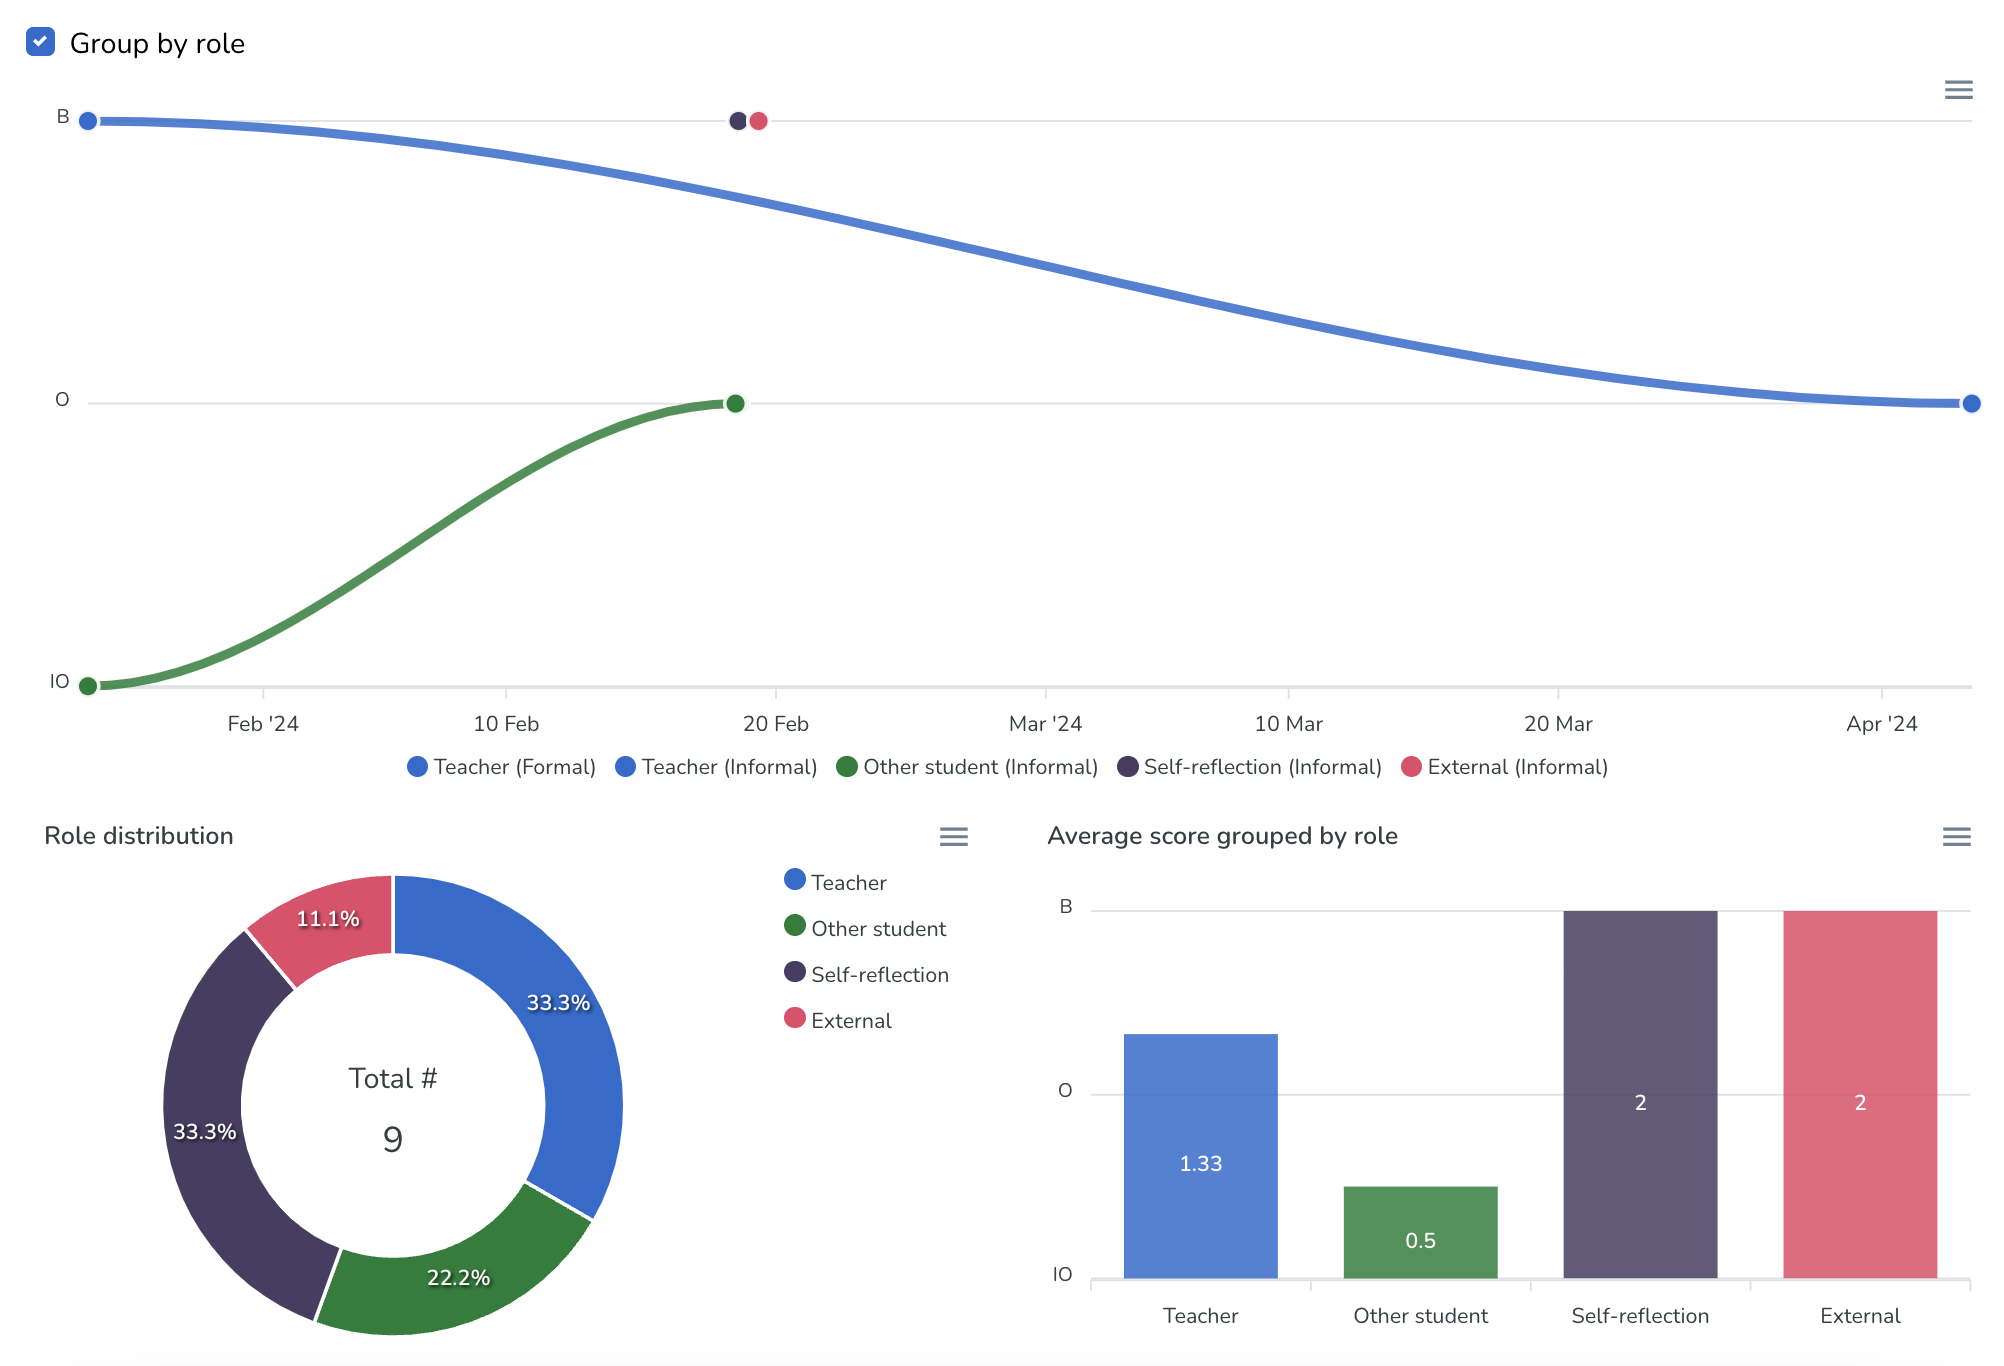
- The first graph displays the development of the student according to each feedback group over time. Note that certain roles (such as the 'Teacher' role in the image) might show two lines, one displaying feedback received via 'Formal' channels as well as one received via 'Informal' channels. This is frequently used to distinguish low-stake data points from medium-stakes.
- The 'Role distribution' chart shows the ratio in which feedback groups/roles contributed towards the visualization.
- The 'Average score grouped by role' chart shows the average score (using the nominal values of the grading scheme) for each feedback group/role involved. You can inspect each bar by hovering over it to see how the displayed nominal value relates to the closest grading scheme step.
Any feedback that was received without a quantitative evaluation, for example when working with a narrative grading scheme, is shown on a timeline directly below (1).
¶ Subcategory spiderweb
If you have selected a specific category level, a subcategory spiderweb visualization is shown for that category level at the bottom of the 'Analytics' tab.
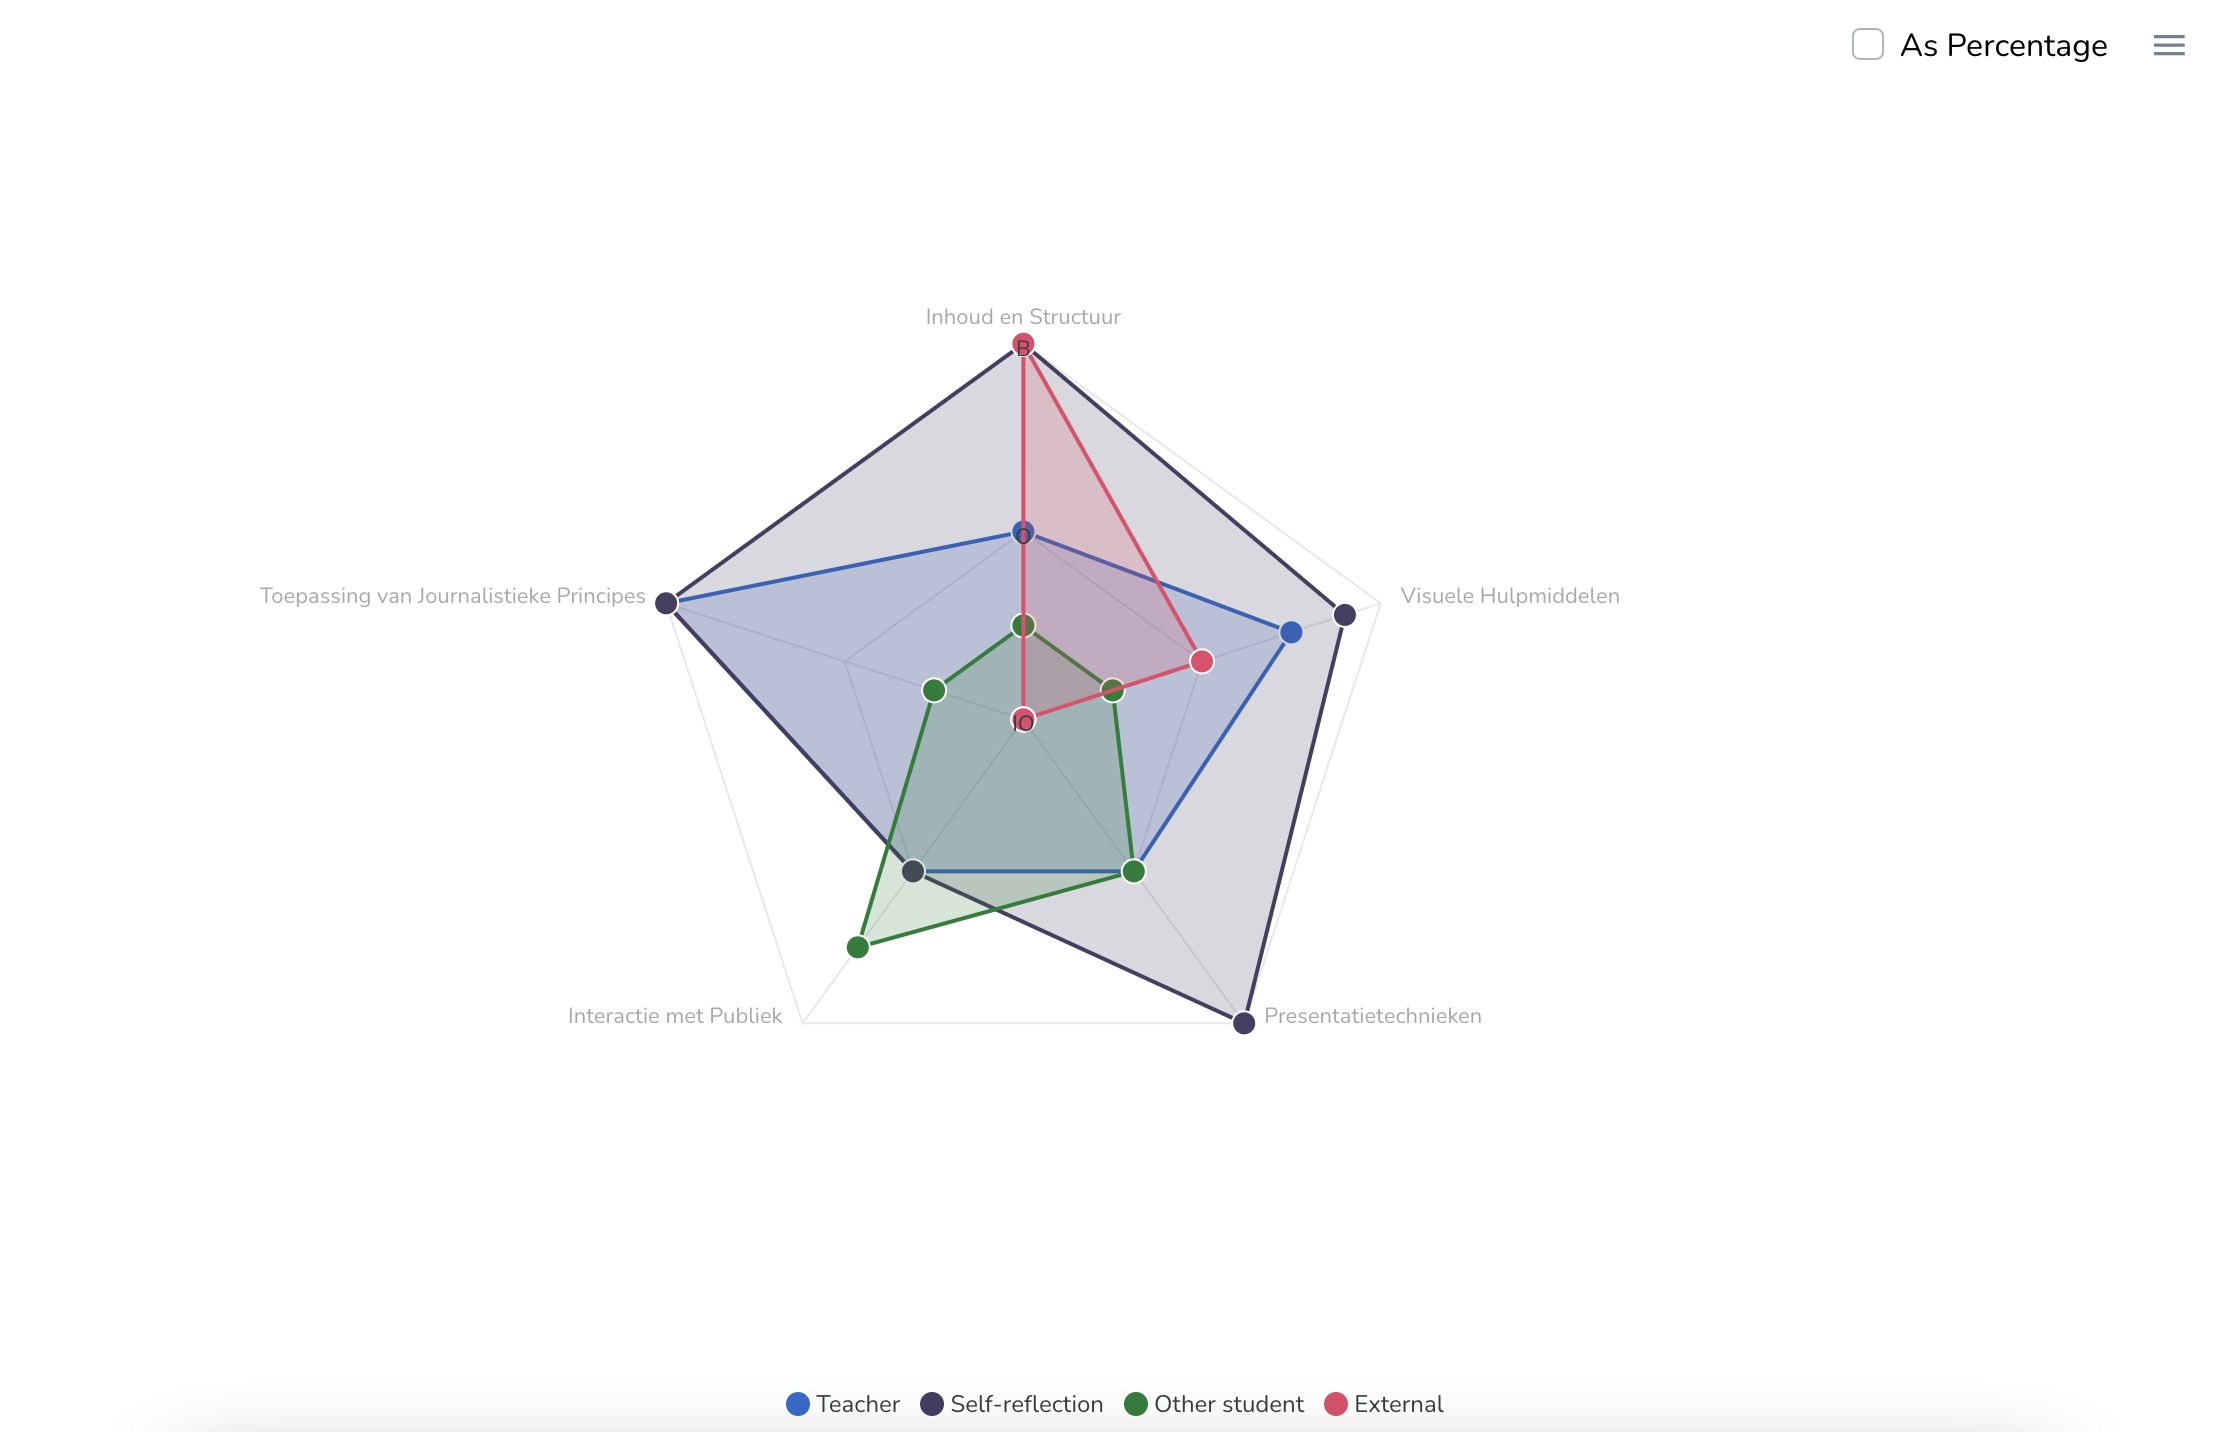
For each of the different feedback groups, a spiderweb graph is rendered showing the average evaluations of that feedback group for each of the subcategories. You can inspect any of the data points to view an overview of what feedback activities yield this average.
¶ Overview of all received feedback
Below the category insights, you will find an overview of all the feedback the user has received (and you are involved with).
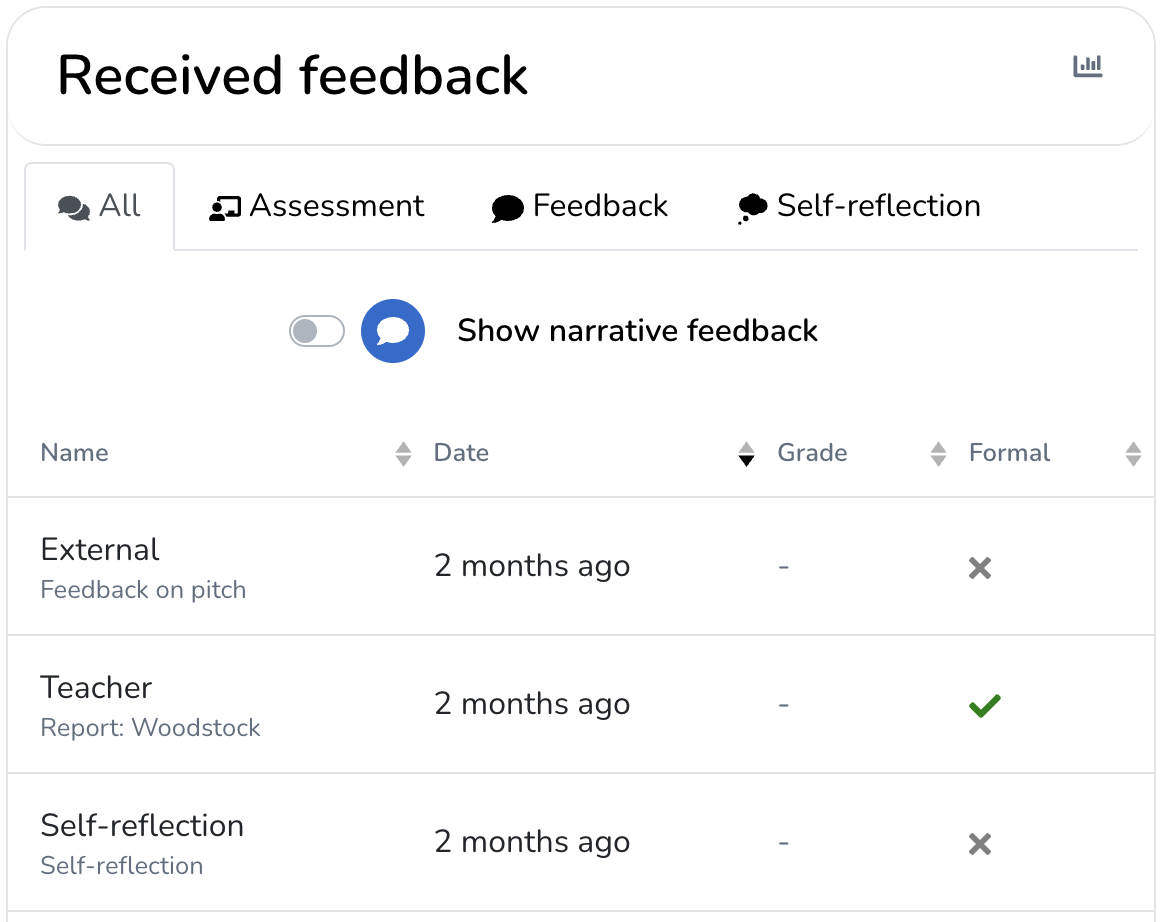
- Equal to the category-based insights, by default, received feedback is grouped into three groups: (formal) assessments, self-reflections, and feedback received from other sources. You can switch between the feedback groups via the tabs at the top.
- In this view, the 'Grade' column shows the overall grade of the feedback activity. When only category-related feedback was provided, this will show as '-'.
¶ Overview of all requested feedback
Next to the received feedback section, you will find an overview of all requested feedback.
- This is especially useful to check how active the user is in collecting feedback themselves, since requested feedback will only show in the received feedback section once the reviewer has actually provided and submitted feedback.
- Since any feedback requests directed at you will also show here, you can make use of this to sort the requests by the 'Status' column to see if there are still some drafts or unstarted requests that still require your attention.

Each feedback request will show the name and feedback group/role of the reviewer (1), as well as the name of the activity (2) that is under review when working with formal assessments. Each feedback request shows the review window (3), that is, from which moment in time could the review start until the expiry date of the request itself. The status column (4) will show whether the request is locked, in progress (draft), or available. If the user has formulated a message to accompany the feedback request, you can inspect it via the chat icon (6).
You can open any feedback request via 'View Details' (5) to view the published feedback, or you can click on the request itself to view the feedback mode and inspect the full context of the request.
¶ Milestone results
At the bottom of the user dashboard, you will find a milestones section, provided the user has defined any milestones you are involved with.
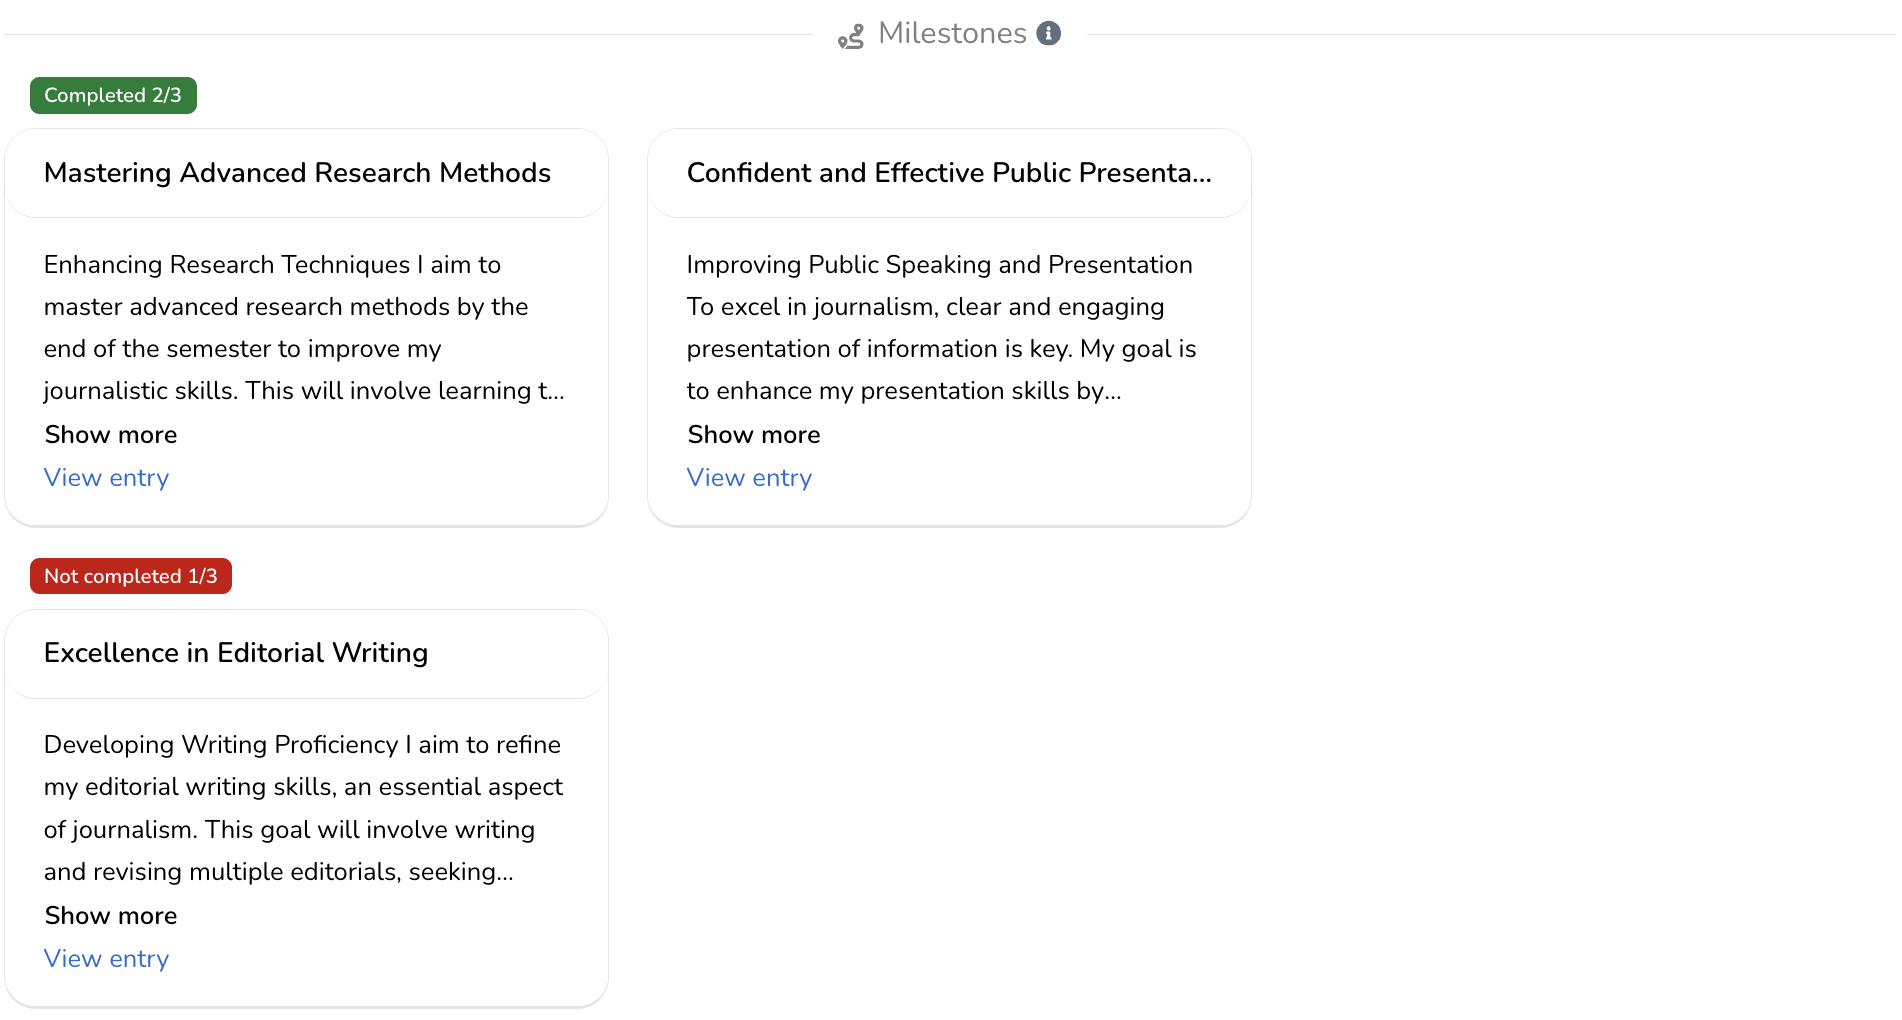
Here you find an overview of all formulated milestones, including an indication of whether the milestone has been marked as complete and the ability to navigate to the entry where the milestone was defined.