The collection dashboard is dedicated to tracking the progress of an individual student and provides insights into their development based on the results of a specific collection.
¶ Differences between the user and collection dashboard
Most of the functionalities of the collection dashboard are similar to the user dashboard, so we advise going over that page first. The difference lies in the following:
- Category-focused insights can be compared with other groups
- You can visualize the development of a student based on a specific rubric in the form of a spiderweb graph
- The data in the dashboard is specific to the collection you are visiting and can be consulted while providing a final assessment.
¶ How to access the collection dashboard
You can access the collection dashboard by navigating to the respective collection. Here you will find the dashboard via the 'Dashboard' tab on the left-hand side.
¶ Category-focused insights group comparison
In the collection dashboard, the category-focused insights are expanded with the ability to compare the progress with other groups. To do this, select the group you would like to compare with from the 'Compare with group' menu under the category section header. You'll be able to see a comparison of the progress in each level and feedback group.

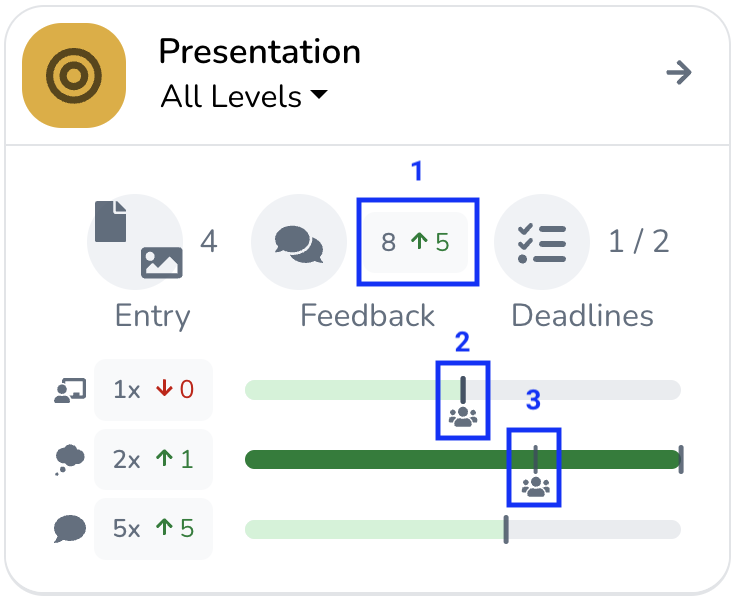
For example, you can see that the student has collected 8 unique feedback activities, which is 5 higher than the group average (1). We can also see that the average formal quantitative evaluation by teachers is equal to the group average (2), and that the student's average quantitative self-reflection score is far higher than the group average (3).
In order to safeguard the privacy of other students part of the comparison group, this feature is only available if at least five other students have received feedback for the same feedback group and category level combination.
¶ Rubric insights
At the bottom of the collection dashboard, you have a section dedicated to Rubric insights.

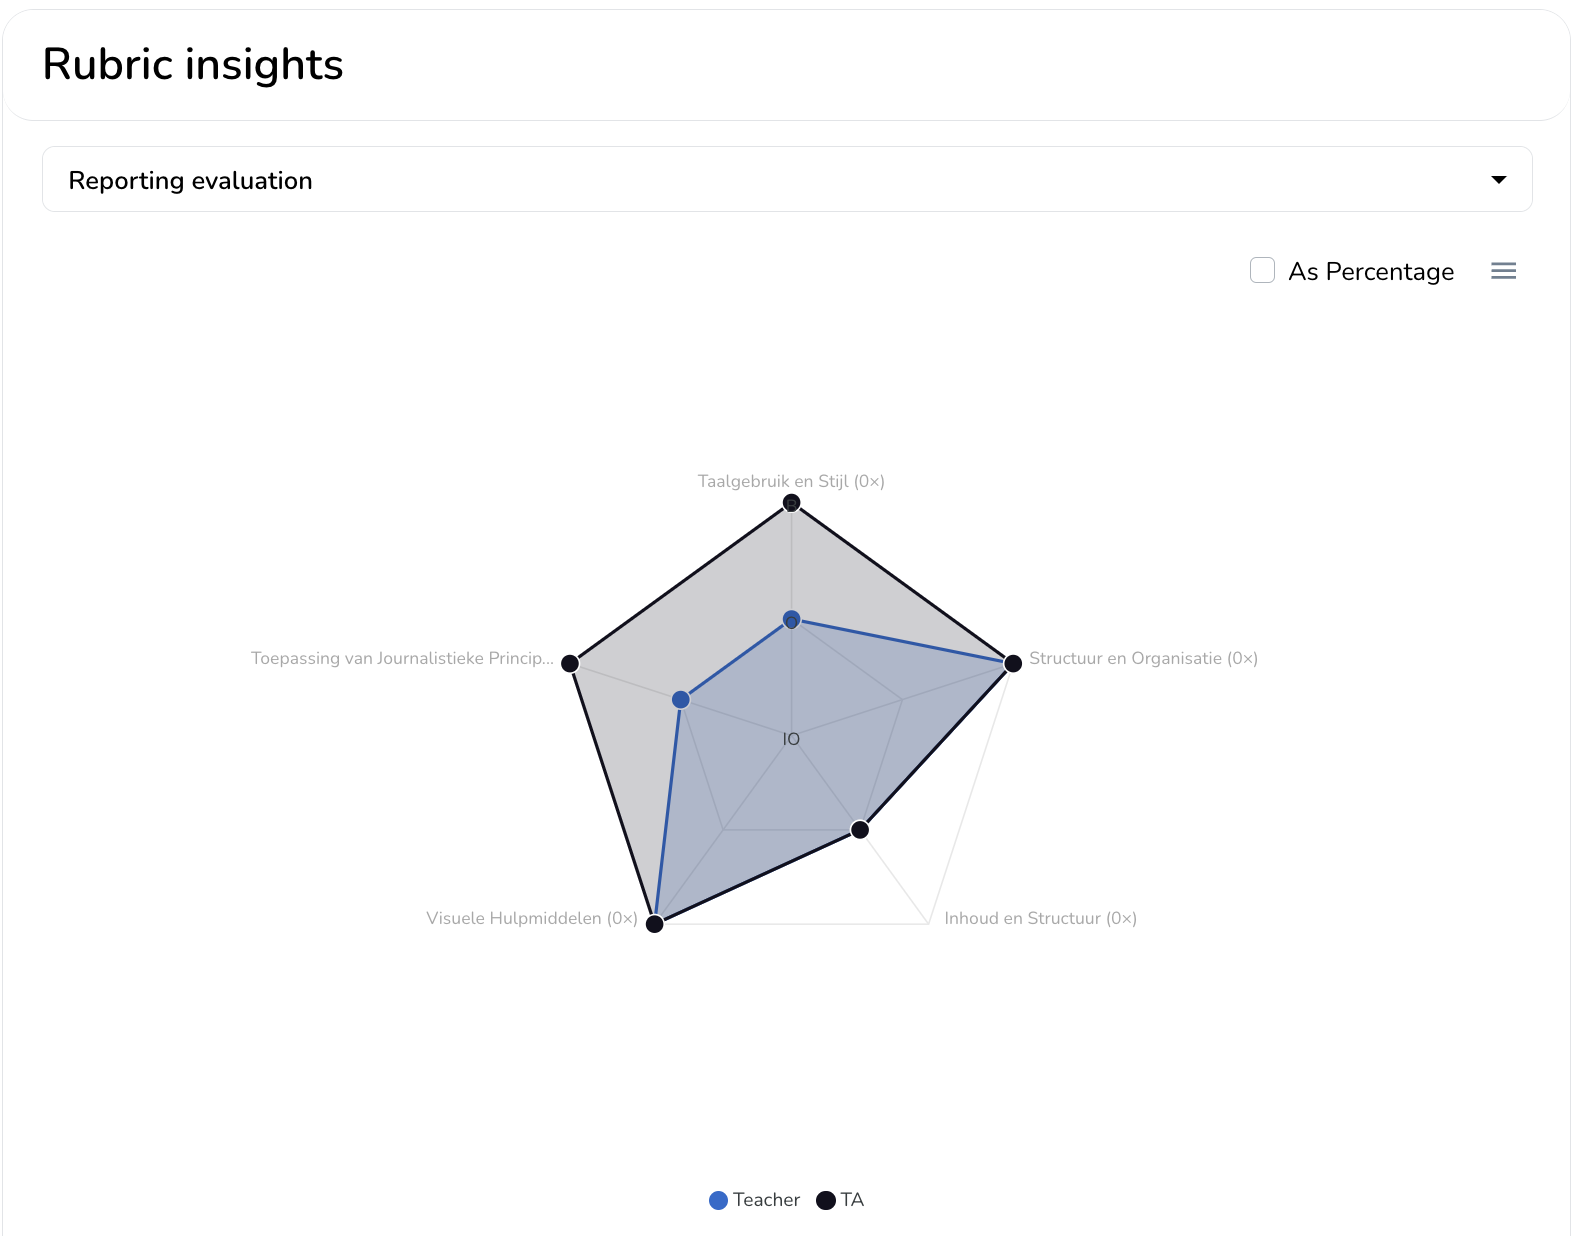
Here you can select any of the rubrics that are used within the assignment to create a spider web visualization for the criteria of the rubric. The following limitations apply:
- Only rubrics using a quantitative grading scheme can be selected, so, for example, rubrics using a narrative grading scheme are disabled.
- For an ideal visualization, the rubric should contain 3 or more criteria, although we do show visualization for fewer criteria.
- The data used to create the visualization makes use of formal assessments, excluding final assessments.
After selecting the rubric of choice, you will be presented with a spider web visualization using the criteria of the rubric.

A web is rendered for each feedback group/role that made use of the rubric, displaying the average evaluation of each of the criteria. It is possible to inspect any of the data points to see a list of the underlying feedback activities that yield the average.